Reports are a great way to see data you have gathered in an easy-to-digest format. However, what if I told you haven’t really “seen” until you have worked with Salesforce Dashboards?
Keep reading to learn more about dashboards AND how to create your own!
What are Dashboards?
Dashboards are a graphical representation of Reports used in Salesforce. They show data from source reports as visual components. These components provide a snapshot of key metrics and performance indicators of the organization at a glimpse. Who doesn’t enjoy customization!? With Dashboards you can individualize components to display data that suits your style, and view your key metrics.
Dashboard Components
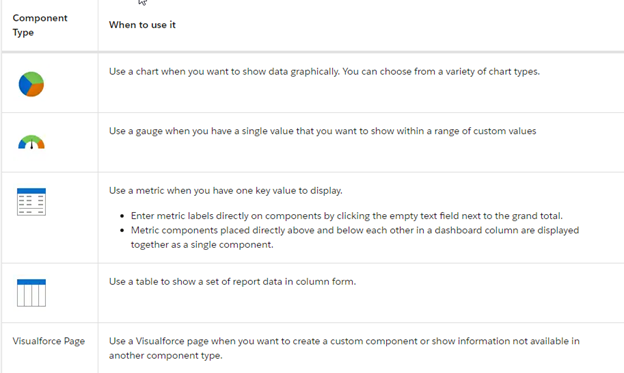
Components are what make Dashboards come alive! They are the building blocks of your Dashboard and a gateway to Salesforce Narnia (not a real place). So, what are Dashboard components? What are the different types? Dashboard components can be charts, tables, gauges, metrics, and Visualforce pages. In simpler terms, components are pictures of your data.
Here are steps to follow:
Step 1: Create Salesforce Dashboards
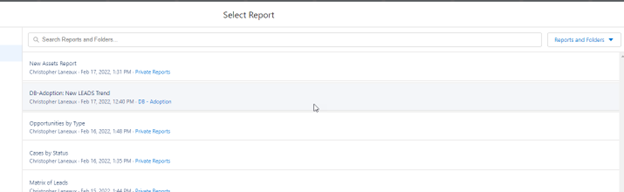
Step 2: Select Report
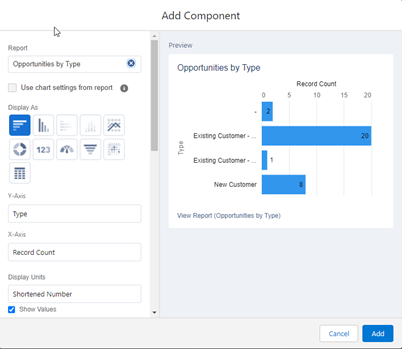
Step 3: Add Component(s)
Step 4: Save Dashboard
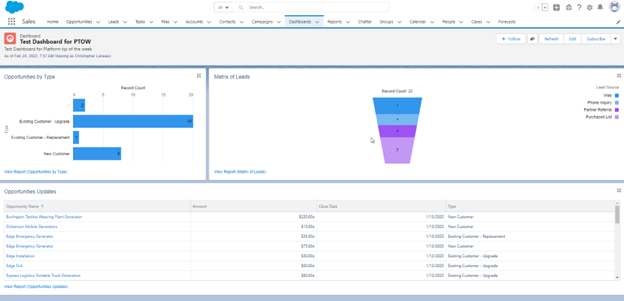
There you have it! A nice, clean look at your data. Dashboards allow you and your team to see the data that really matters to you.
Salesforce Dashboards Fun Facts:
Dashboard Filters
Dashboard filters make it easy for users to apply different data perspectives to a single dashboard. Filtering rules apply to fields from the dashboard’s source reports. After filters are defined, a user viewing the dashboard can select a filter to visualize the data of most interest. The filtered view is remembered – the next time the user visits the dashboard, the same filtered view is shown.
Subscribe to/Schedule Dashboards
Set up automatic dashboard refreshes and receive refreshed dashboard results by email on a schedule that you set. If you start your week by reviewing your Sales Overview dashboard, expedite your morning by subscribing to the dashboard. After subscribing, you can have it automatically refreshed and in your email inbox each Monday morning at 8:00 AM.
You can add up to 20 components to view on a Dashboard.
And there you have it! Now you can create dashboards, add components to better view reports, and customize & edit to your liking! If you’d like to learn more about using platforms like Salesforce, integrating existing systems with Salesforce, or custom platform development, we’re here to help. Drop us a line any time!